Factor Analysis (PCA)
Attribute and product PCA plots are calculated in seconds.
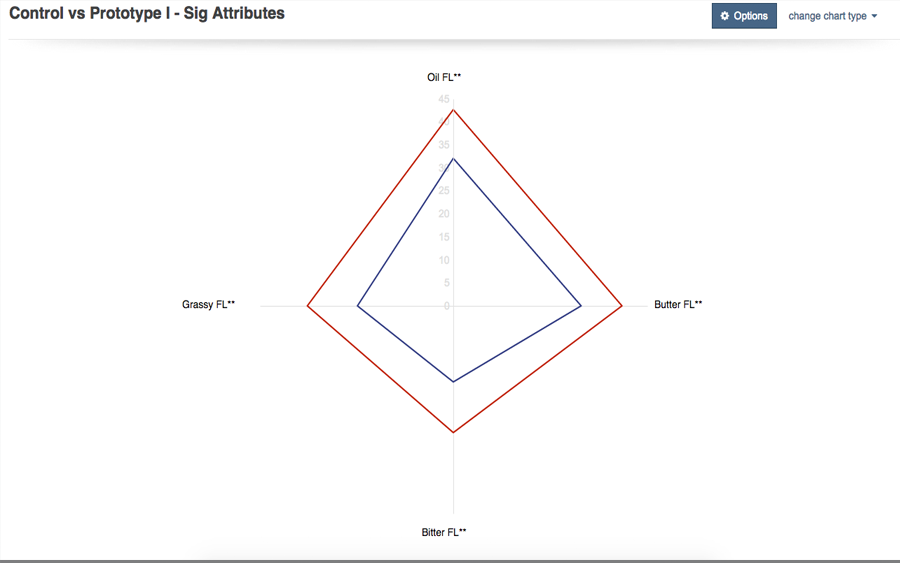
Control vs. Test
Identify how close you are to a Control product with the click of a button.
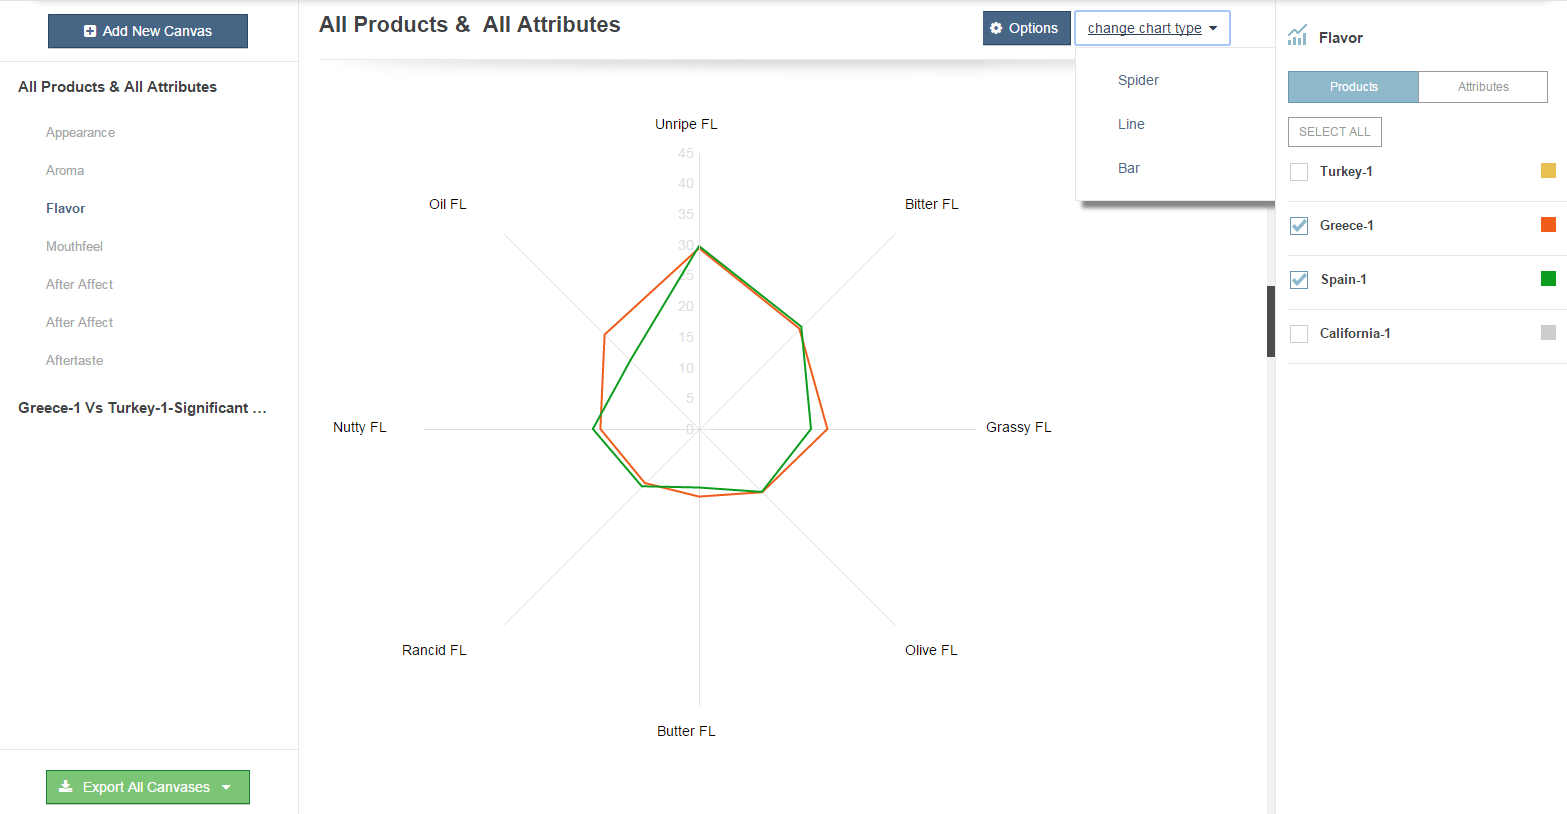
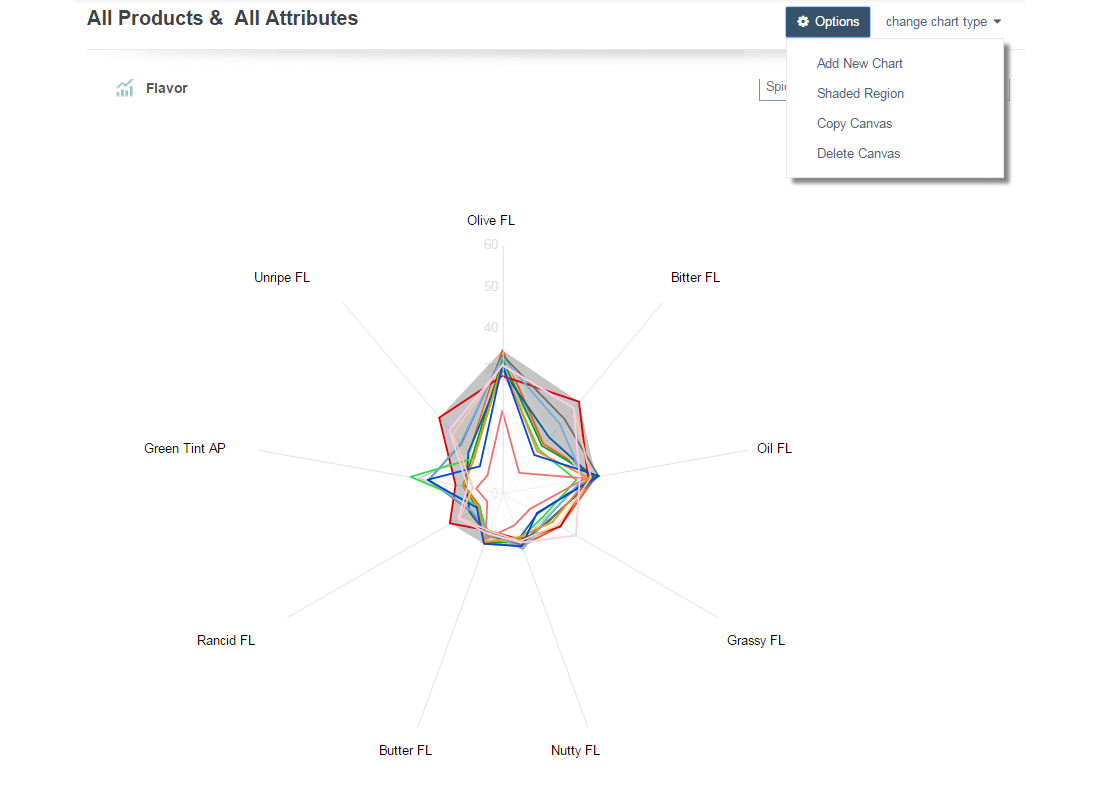
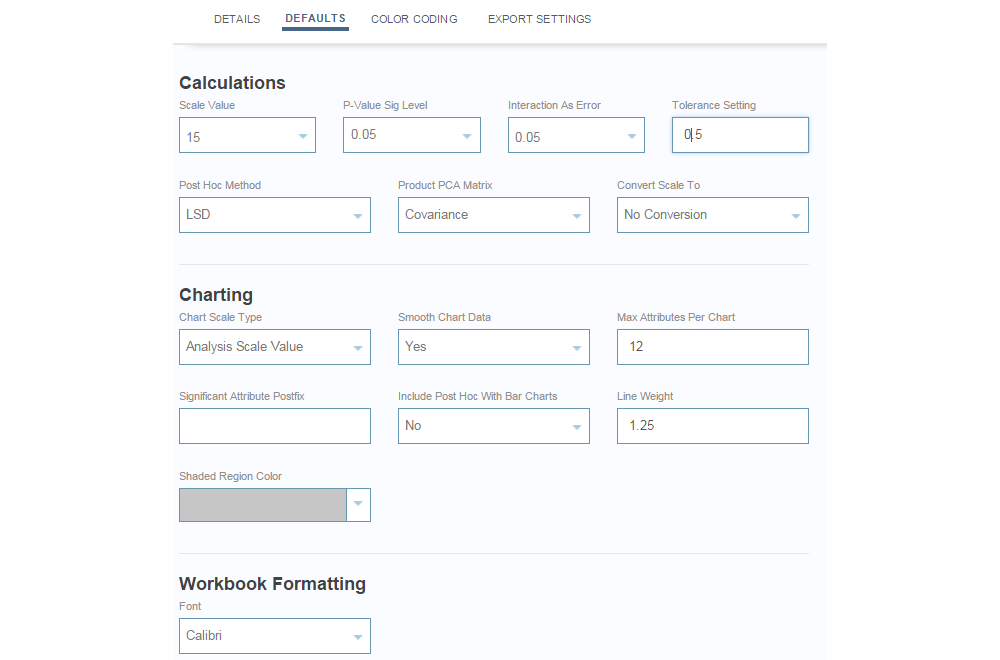
Customize Charts
Powerful charting options allow you to create customized plots in seconds.
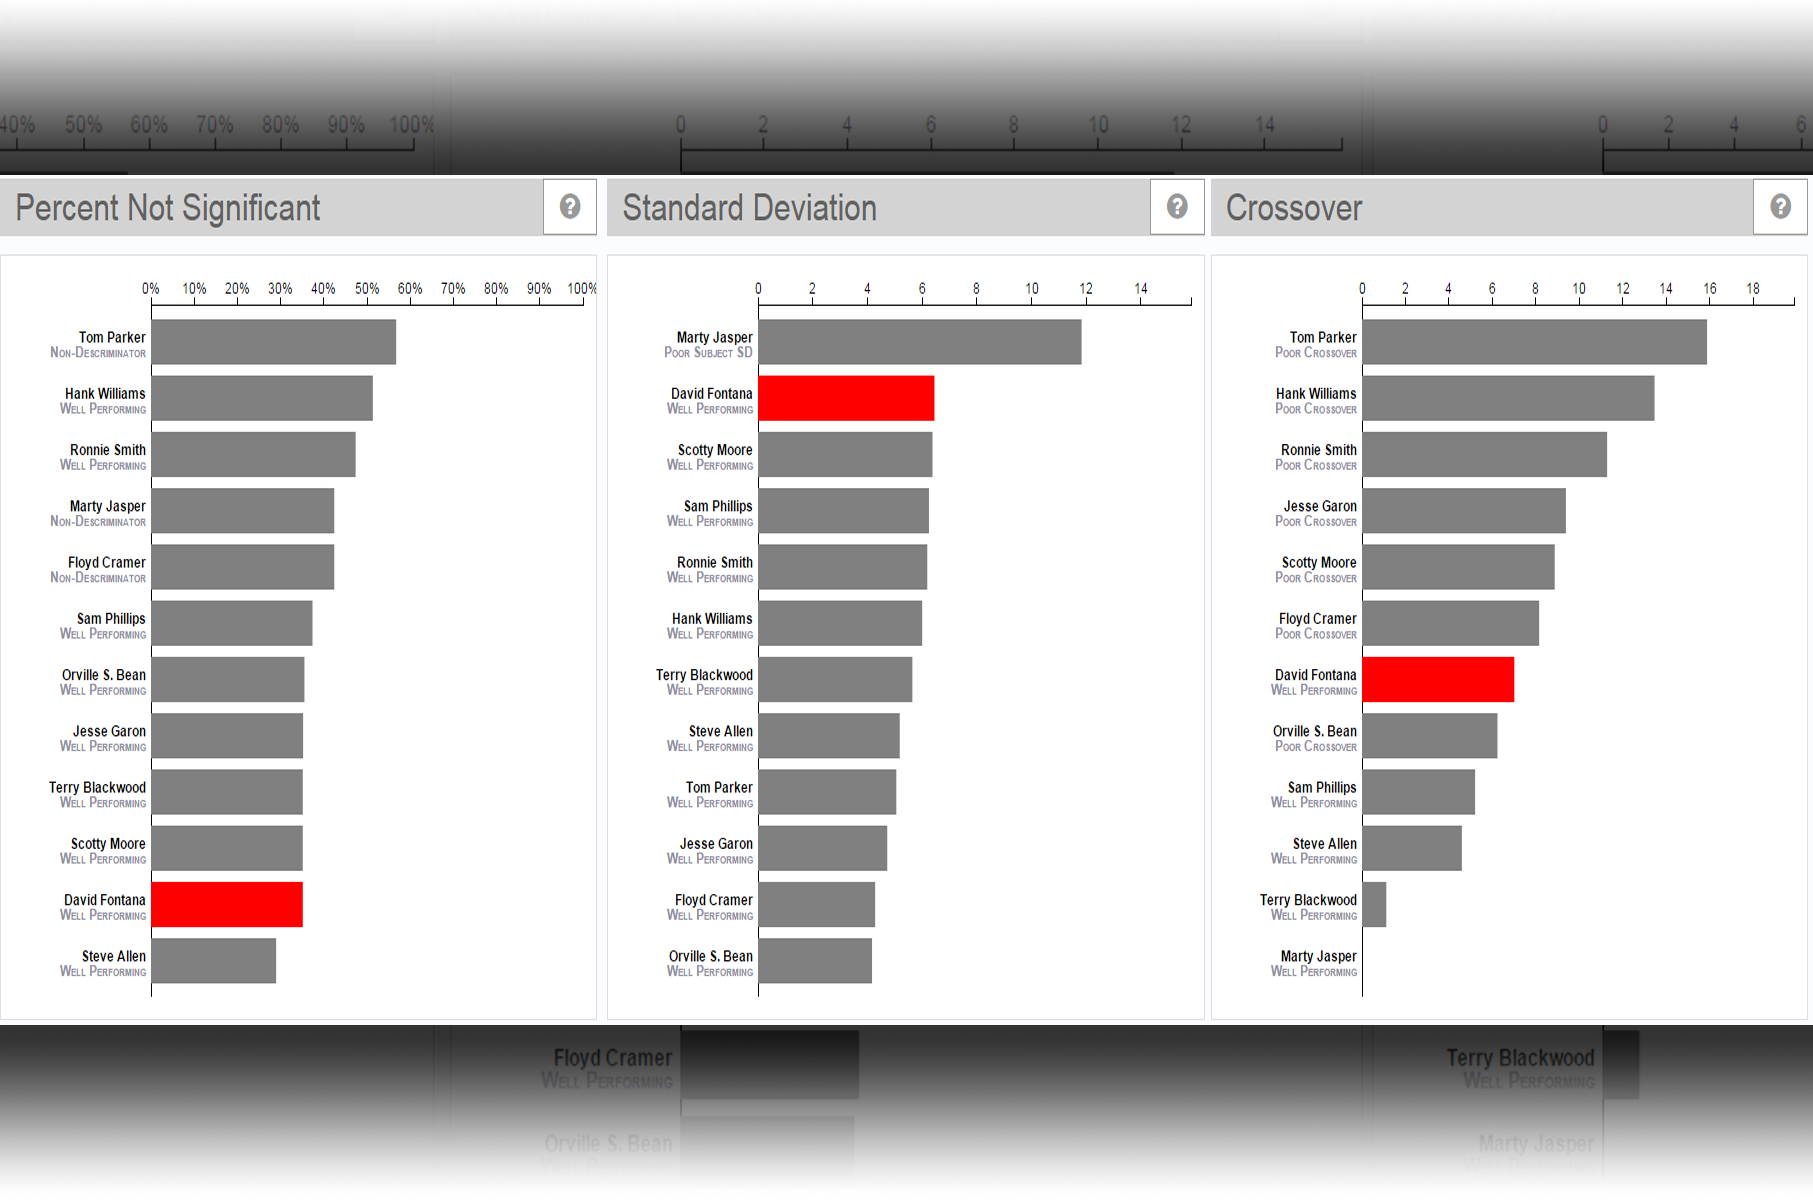
Panel Performance
Analysis available across individual or multiple projects.
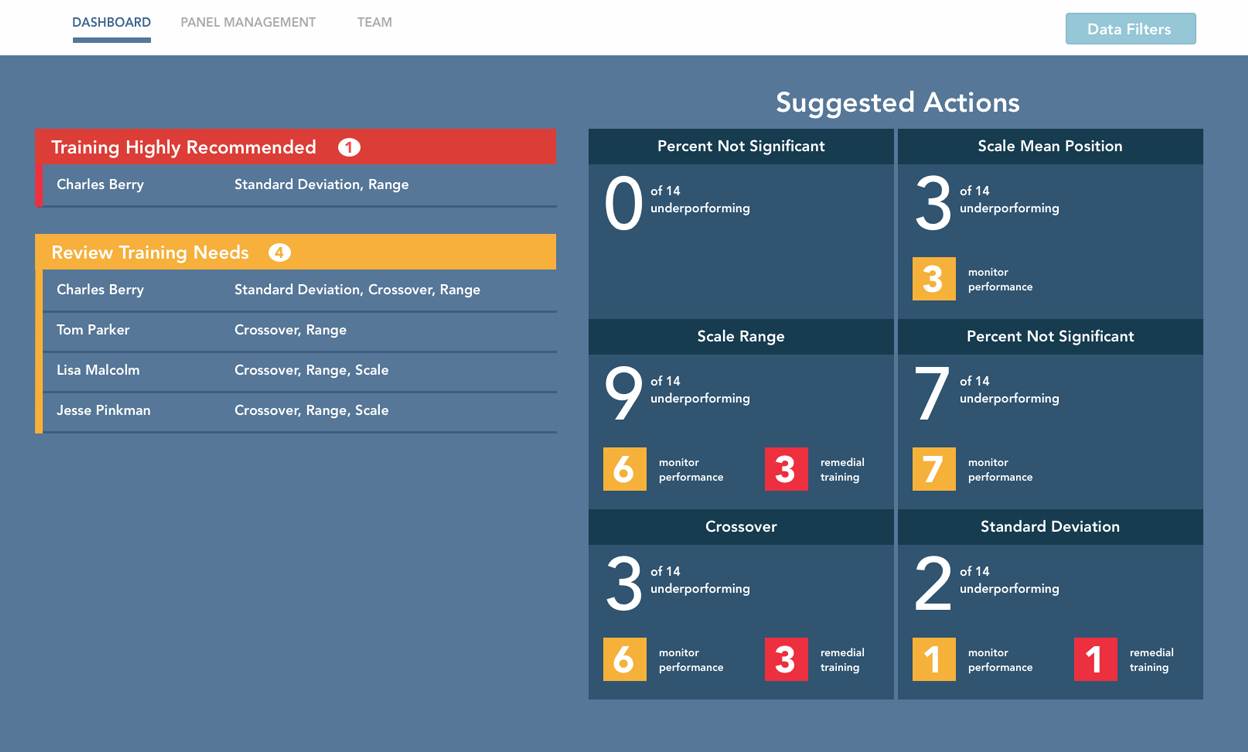
Panel Guidance
Improve your panel’s future performance with recommended actions.
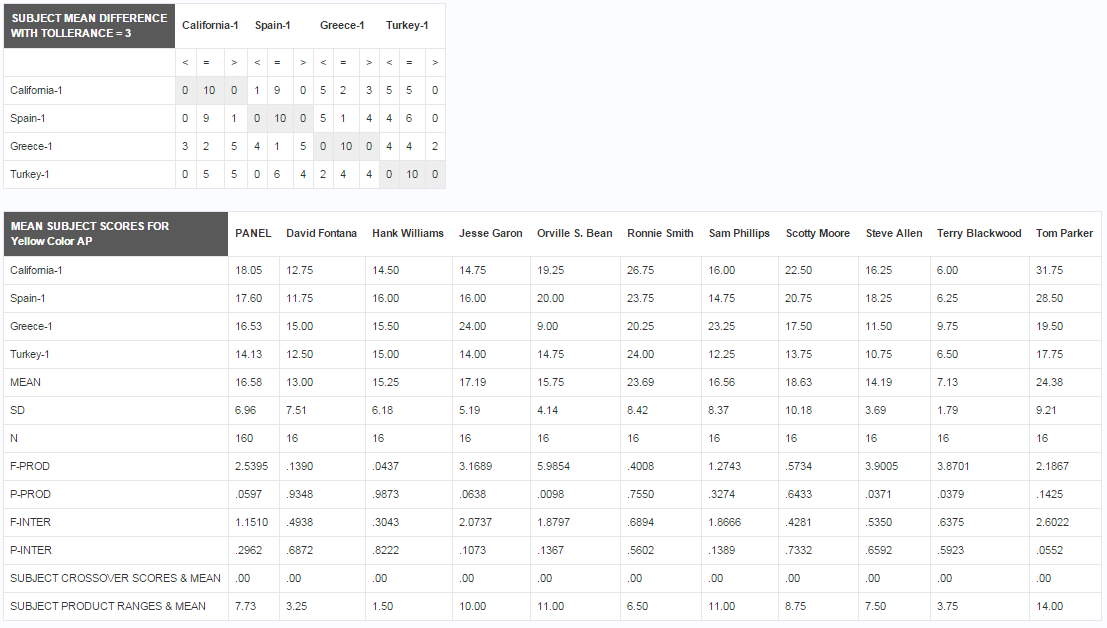
Attribute Performance
Provides detailed information for each attribute.
Shaded Regions
Immediately identify whether products fall within a specific range.
One App, All Methods
Wheter you use The Spectrum Method or QDA, RedJAde has your back.
Summary/Detail Views
RedJade provides you with both summary and detailed information in one place.
Factor Analysis (PCA)
Attribute and product PCA plots are always available. In fact, you can remove an attribute or product and the PCA recalculates in seconds. Highlight important products and/or attributes, chart any combination of factors, all with a click of your mouse.
Control vs. Test
Are you qualifying a new supplier? Are you bringing a new plant online? Do you think your product has changed over time? Quickly identify product similarities and differences between Control and any product(s) you choose. Chart all attributes, significant attributes, or only attributes that are significant between the two chosen products.
Customize Charts
RedJade’s charting options give you complete control over your data. Select the attributes and products you want to include on a plot. Change one chart or all charts from a spider plot to a line chart and back. Graph only significant attributes. All without ever touching a data file – only in RedJade.
Panel Performance
RedJade’s panel performance analyses are unrivaled. Identify how your panel is performing across one project or multiple projects including discrimination, scale range, scale mean position, crossover, standard deviation, and our newest panel performance metric – Attribute Decision Influence.
Panel Guidance
RedJade not only calculates panel performance metrics, it also provides you with recommended actions for your panel, improving future panel performance. And only RedJade allows you to remove a panelist and re-run your data without ever touching your data file.
Attribute Performance
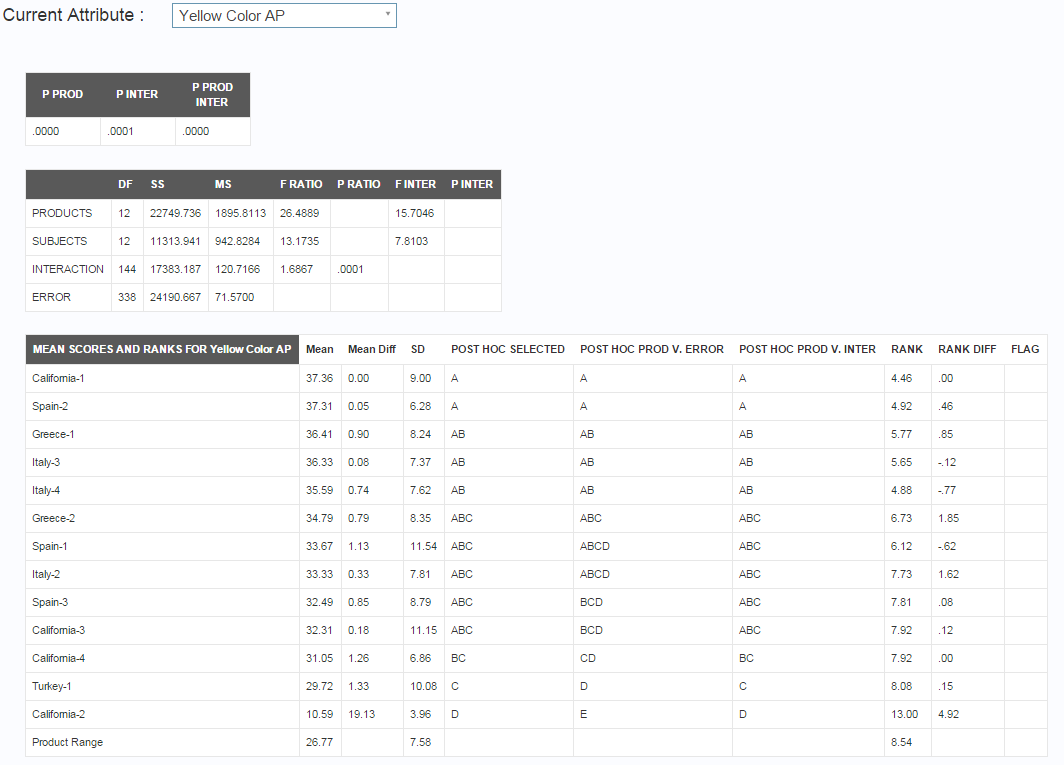
RedJade takes a detailed look at each attribute and creates a report that allows the panel leader to understand how the panel is performing on each individual attribute. This gives the moderator the ability to identify attributes that need additional attention.
Shaded Regions
Shaded Regions is all about saving time. It allows you to select products or numeric values and shades the area in-between. This allows you to quickly and easily identify if your production run is within the specified range.
One App, All Methods
Do you use The Spectrum Method or QDA? Do you use something in-between? RedJade will analyze your data and provide you with both detailed and summary information consistent with your methodology.
Summary/Detail Views
RedJade provides an overview of your panel to quickly and easily identify product similarities and differences, understand how your panel is performing and provide suggestions to improve your panel. And after viewing the summary information you want to delve deeper, it’s right at your fingertips.

